Chart Report Sample Answer
Chart Report Title: The Percentage Of Australian Who Exercised Regularly In 2010
Keywords or Topics: sport
The samples about "The percentage of Australian who exercised regularly in 2010" are handy resources for students to enrich their writing skills of chart report.
Besides, more chart report questions sharing the topic of "sport" are added to help students understand the different requirements and target the assignments precisely.
| Actions & New chart report examples |
| Chart questions and samples |
Question:
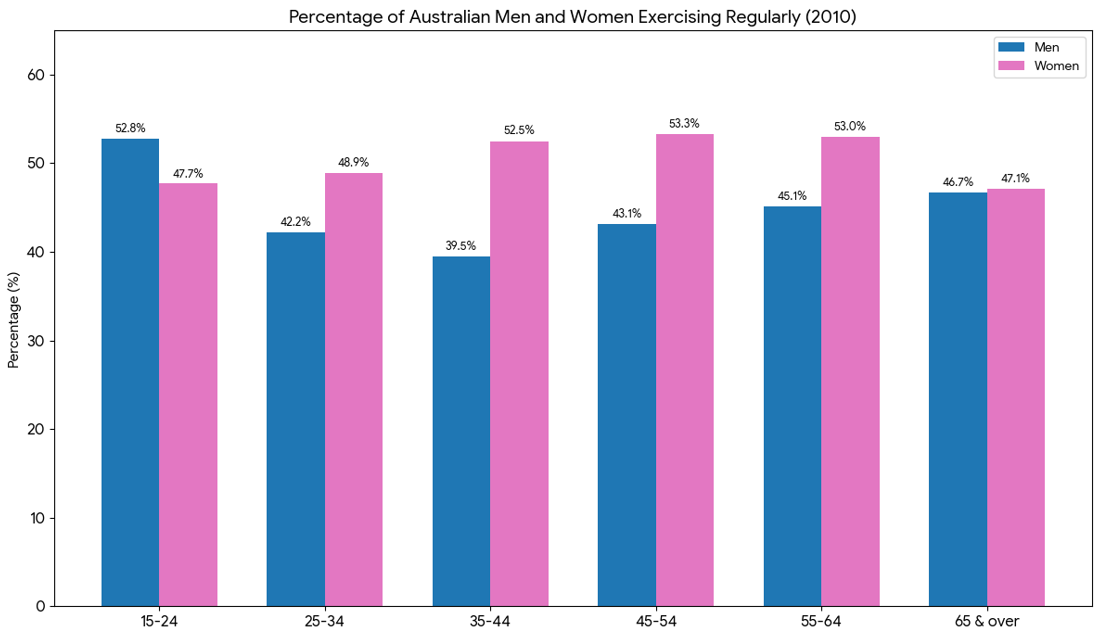
The bar chart below shows the percentage of Australian men and women in different age groups who exercised regularly in 2010.
Summarize the information by selecting and reporting the main features, and make comparisons where relevant.
Write at least 150 words.
Summarize the information by selecting and reporting the main features, and make comparisons where relevant.
Write at least 150 words.
Answer 1
The bar chart illustrates the proportions of male and female Australians across six age groups who engaged in regular physical activity in 2010...
Overall, it is evident that women were generally more active than men across most age groups, except the youngest...
Among the youngest group (aged 15–24), men were more active than women, with 52.8% exercising regularly compared to 47.7% of females...
In contrast, female participation increased steadily with age. The percentage of active women rose from 47.7% in the youngest group to a peak of 53.3% in the 45–54 age category...
Band: 8
Word Statistics
| Group | Word Number | Distinct | Percent |
|---|---|---|---|
| All Words | 216 | 107 | 49% |
| Top 300 Words | 81 (37%) | 26 (24%) | 32% |
| 300 - 1000 Words | 47 (21%) | 23 (21%) | 48% |
| Over 1000 Words | 88 (40%) | 58 (54%) | 65% |
Other Comments (matthewblack)
Link Words: 11 (including link phrase: 0)
Sentences: Number: 10; Average Length: 133 characters; Words/Sentence: 21
Repeated Words: age(8), women(7), and(6), men(6), active(4), with(4), groups(3)
Chart Report Questions for Topic : sport
Samples