Chart Report Sample Answer
Chart Report Title: The Percentage Of Women Working In Different Fields In China
Keywords or Topics: job
The samples about "The percentage of women working in different fields in China" are handy resources for students to enrich their writing skills of chart report.
Besides, more chart report questions sharing the topic of "job" are added to help students understand the different requirements and target the assignments precisely.
| Actions & New chart report examples |
| Chart questions and samples |
Question:
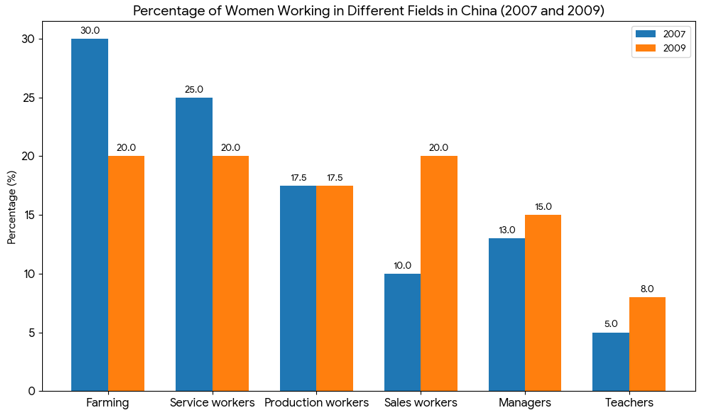
The bar chart below shows the percentage of women working in different fields in China in 2007 and 2009.
Summarize the information by selecting and reporting the main features, and make comparisons where relevant.
Write at least 150 words.
Summarize the information by selecting and reporting the main features, and make comparisons where relevant.
Write at least 150 words.
Answer 1
The bar chart compares the distribution of the female workforce across six occupational sectors in China in 2007 and 2009...
Overall, the period saw a significant shift in female employment. There was a clear trend away from traditional roles in agriculture and services toward more commercial and professional fields...
In 2007, farming was the leading employer for women, accounting for 30% of total employment. However, by 2009, this figure had fallen sharply to 20%...
In contrast, the percentage of women working in sales doubled, rising from 10% in 2007 to 20% in 2009, bringing it to a level with farming and service work...
Band: 8
Word Statistics
| Group | Word Number | Distinct | Percent |
|---|---|---|---|
| All Words | 187 | 104 | 55% |
| Top 300 Words | 79 (42%) | 26 (25%) | 32% |
| 300 - 1000 Words | 29 (15%) | 24 (23%) | 82% |
| Over 1000 Words | 79 (42%) | 54 (51%) | 68% |
Other Comments (scottchapman)
Link Words: 10 (including link phrase: 0)
Sentences: Number: 10; Average Length: 113 characters; Words/Sentence: 18
Repeated Words: female(5), from(5), and(4), 2007(3), 2009(3), was(3), proportion(3)
Chart Report Questions for Topic : job
Samples
2. The hours worked and stress levels
Samples
3. The proportion of women holding staff and management
Samples
4. The occupations of people who immigrated to Australia
Samples
5. The average hours work by part-time and full-time men and women
Samples
6. The duration of housework women did when compared to men
Samples
7. The changes in the proportion of the Australian workforce employed
Samples