Chart Report Sample Answer
Chart Report Title: The Occupations Of People Who Immigrated To Australia
Keywords or Topics: job
The samples about "The occupations of people who immigrated to Australia" are handy resources for students to enrich their writing skills of chart report.
Besides, more chart report questions sharing the topic of "job" are added to help students understand the different requirements and target the assignments precisely.
| Actions & New chart report examples |
| Chart questions and samples |
Question:
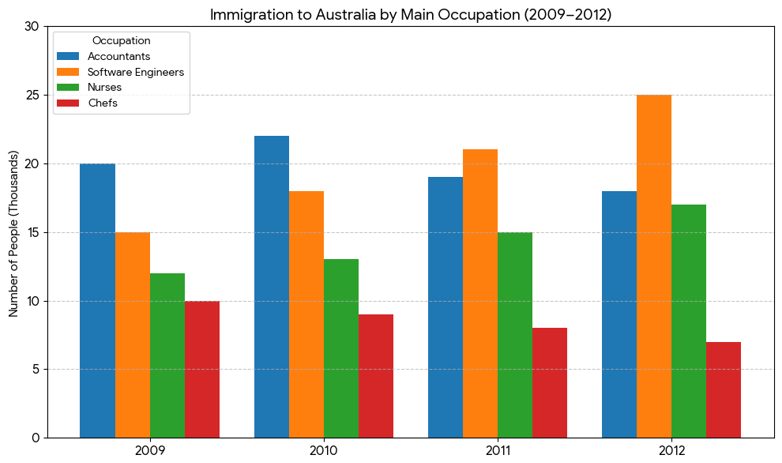
The bar chart below shows the number of people who immigrated to Australia between 2009 and 2012 for four specific occupations: Accountants, Software Engineers, Nurses, and Chefs.
Summarize the information by selecting and reporting the main features, and make comparisons where relevant.
Write at least 150 words.
Summarize the information by selecting and reporting the main features, and make comparisons where relevant.
Write at least 150 words.
Answer 1
The bar chart shows the number of immigrants entering Australia by four primary professions over 4 years, from 2009 to 2012...
Overall, the period was characterized by a surge in the recruitment of technology and healthcare professionals, while traditional roles such as accounting and culinary arts saw a decline in popularity...
In 2009, accountants were the largest group with 20,000 immigrants. Although this number peaked at 22,000 in 2010, it subsequently declined to 18,000 by 2012...
Chefs represented the smallest and only consistently declining group in the chart. Starting at 10,000 in 2009, the figure declined each year, ending at just 7,000 in 2012...
Band: 8
Word Statistics
| Group | Word Number | Distinct | Percent |
|---|---|---|---|
| All Words | 192 | 111 | 57% |
| Top 300 Words | 79 (41%) | 30 (27%) | 37% |
| 300 - 1000 Words | 29 (15%) | 22 (19%) | 75% |
| Over 1000 Words | 84 (43%) | 59 (53%) | 70% |
Other Comments (kimbolan)
Link Words: 11 (including link phrase: 1)
Sentences: Number: 10; Average Length: 122 characters; Words/Sentence: 19
Repeated Words: 2009(4), number(3), immigrants(3), year(3), from(3), 2012(3), and(3)
Chart Report Questions for Topic : job
Samples
2. The hours worked and stress levels
Samples
3. The proportion of women holding staff and management
Samples
4. The percentage of women working in different fields in China
Samples
5. The average hours work by part-time and full-time men and women
Samples
6. The duration of housework women did when compared to men
Samples
7. The changes in the proportion of the Australian workforce employed
Samples