Chart Report Sample Answer
Chart Report Title: The Employment Patterns In The USA Between 1930 And 2010
Keywords or Topics: employment
The samples about "The employment patterns in the USA between 1930 and 2010" are handy resources for students to enrich their writing skills of chart report.
Besides, more chart report questions sharing the topic of "employment" are added to help students understand the different requirements and target the assignments precisely.
| Actions & New chart report examples |
| Chart questions and samples |
Question:
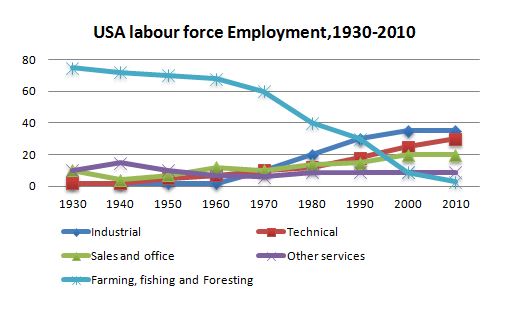
The graph below presents employment patterns in the USA between 1930 and 2010.
Summarize the information by selecting the main features and reporting them, and make comparisons where relevant.
Write at least 150 words.
Summarize the information by selecting the main features and reporting them, and make comparisons where relevant.
Write at least 150 words.
Answer 1
In 1930, 75% of the labor force in the USA was employed in farming, fishing, and forestry, while only 10% worked in sales, office, and trade...
By 1980, the pattern of employment had changed significantly. While farming, fishing, and forestry workers had declined to 40% of the workforce, industrial and technical workers had increased their share to 13% and 10%, respectively...
Similarly, the sales and office sectors did not increase until 1980. By 2000, the most dramatic change was evident, with the proportion of farming, fishing, and forestry workers falling to just 10%, while the three other major sectors had all increased to over 20% of the workforce...
Band: 7
Word Statistics
| Group | Word Number | Distinct | Percent |
|---|---|---|---|
| All Words | 146 | 75 | 51% |
| Top 300 Words | 70 (47%) | 26 (34%) | 37% |
| 300 - 1000 Words | 24 (16%) | 18 (24%) | 75% |
| Over 1000 Words | 52 (35%) | 31 (41%) | 59% |
Other Comments (jadelee)
Link Words: 12 (including link phrase: 0)
Sentences: Number: 7; Average Length: 126 characters; Words/Sentence: 20
Repeated Words: and(8), workforce(4), had(4), farming(3), fishing(3), forestry(3), while(3)
Chart Report Questions for Topic : employment
Samples
2. The information about the percentage of women aged 15-64 in employment
Samples
3. The bar chart shows the number of non-medical staff employed.
Samples