Chart Report Sample Answer
Chart Report Title: The Four Age Groups In UK Married In 1998 And 2008
Keywords or Topics: marry
The samples about "The four age groups in UK married in 1998 and 2008" are handy resources for students to enrich their writing skills of chart report.
Besides, more chart report questions sharing the topic of "marry" are added to help students understand the different requirements and target the assignments precisely.
| Actions & New chart report examples |
| Chart questions and samples |
Question:
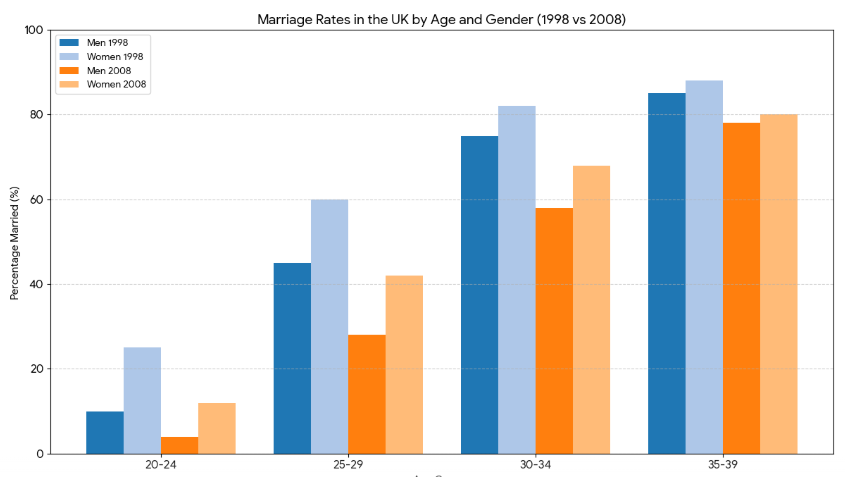
The bar chart shows the percentage of men and women in four different age groups in the UK who were married in 1998 and 2008.
Summarize the information by selecting and reporting the main features, and make comparisons where relevant.
Write at least 150 words..
Summarize the information by selecting and reporting the main features, and make comparisons where relevant.
Write at least 150 words..
Answer 1
The bar chart compares the proportions of married men and women across four distinct age categories in the UK in 1998 and 2008...
Overall, it is evident that marriage rates declined for both genders across all age groups over the ten-year period...
In the younger cohorts, there was a dramatic decrease in the number of married individuals. In 1998, 25% of women aged 20–24 were married, but this figure plummeted to just 12% by 2008...
A similar downward trend was observed in the older age groups, although the marriage rates remained much higher...
Band: 7.5
Word Statistics
| Group | Word Number | Distinct | Percent |
|---|---|---|---|
| All Words | 224 | 116 | 51% |
| Top 300 Words | 94 (41%) | 35 (30%) | 37% |
| 300 - 1000 Words | 42 (18%) | 19 (16%) | 45% |
| Over 1000 Words | 88 (39%) | 62 (53%) | 70% |
Other Comments (jeepsondosey)
Link Words: 15 (including link phrase: 0)
Sentences: Number: 11; Average Length: 117 characters; Words/Sentence: 20
Repeated Words: married(8), and(6), women(6), age(6), from(5), men(4), 1998(3)