Chart Report Sample Answer
Chart Report Title: The Different Modes Of Transportation To Commute To Work
Keywords or Topics: transport, commute
The samples about "The different modes of transportation to commute to work" are handy resources for students to enrich their writing skills of chart report.
Besides, more chart report questions sharing the same topic are linked to help students understand the different requirements and target the assignments precisely. The current chart report has two topics: transport and commute. So, chart report questions about them are listed separately.
| Actions & New chart report examples |
| Chart questions and samples |
Question:
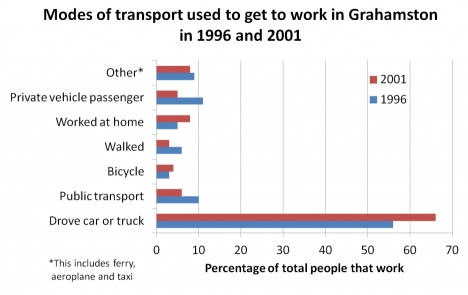
The bar chart below illustrates the percentage of people choosing different modes of transportation (public transport, private transport, cycling, or walking) to commute to work in Grahamston, in 1996 and 2011.
Summarize the information by selecting and reporting the main features, and make comparisons where relevant.
Write at least 150 words.
Summarize the information by selecting and reporting the main features, and make comparisons where relevant.
Write at least 150 words.
Answer 1
The bar chart shows the different types of transportation used to commute to work in Grahamston in 1996 and 2001...
Overall, cars and trucks were the most prevalent modes of transportation to get to work in 1996, and their share increased by 2001, as did the proportions of people who cycled to work and worked at home...
In 1996, driving a car or truck to work was the most popular mode, accounting for around 55%. Meanwhile, the percentages of people taking public transportation, using private vehicles, or using other alternatives (ferry, aeroplane, and taxi) to commute to work were almost the same: 10%, 12%, and around 9%, respectively...
In 2001, the percentage of employees commuting to their work by car or truck grew significantly, peaking at 65% and surpassing all other means of transport...
Band: 8
Word Statistics
| Group | Word Number | Distinct | Percent |
|---|---|---|---|
| All Words | 253 | 109 | 43% |
| Top 300 Words | 123 (48%) | 30 (27%) | 24% |
| 300 - 1000 Words | 33 (13%) | 23 (21%) | 69% |
| Over 1000 Words | 97 (38%) | 56 (51%) | 57% |
Other Comments (scottchapman)
Link Words: 20 (including link phrase: 0)
Sentences: Number: 11; Average Length: 142 characters; Words/Sentence: 23
Repeated Words: and(12), for(8), work(7), transportation(4), other(4), using(3), 1996(3)
Chart Report Questions for Topic : transport
Samples
2. The different forms of transport in four countries
Samples
3. The rail transport in four countries
Samples
4. The ways of students in the UK to travel to school
Samples
5. The information on the delays and cancellations of a train company
Samples
6. The people using public transport and private cars in Australia
Samples
7. The trips made by different means of transport in the UK
Samples
8. The different methods of transportation used by UK university students
Samples