Chart Report Sample Answer
Chart Report Title: The Average Consumption Of Food
Keywords or Topics: food
The samples about "The average consumption of food" are handy resources for students to enrich their writing skills of chart report.
Besides, more chart report questions sharing the topic of "food" are added to help students understand the different requirements and target the assignments precisely.
| Actions & New chart report examples |
| Chart questions and samples |
Question:
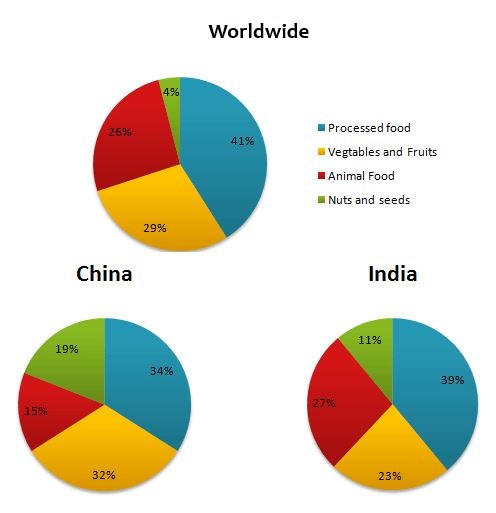
The pie charts show the average food consumption worldwide in 2008, compared with the data for two countries: China and India.
Write a report to a university lecturer describing the data.
Write at least 150 words.
Write a report to a university lecturer describing the data.
Write at least 150 words.
Answer 1
The graphs show worldwide consumption of 4 food types in 2008, with comparisons to the amounts consumed in China and India in the same year...
Overall, the two countries showed different food consumption patterns from the world average, while processed food still accounted for the largest share in all three charts...
In particular, processed food consumption was highest worldwide, at 41%, followed by vegetables and fruits at 29% and animal food at 25%...
Likewise, China used processed food at the highest rate, 39%. Animal food showed the same figure as the world’s average, 25%...
In India, both vegetable and processed food were used most in the year 2008, with percentages of 34% and 32%, respectively...
Band: 8.5
Word Statistics
| Group | Word Number | Distinct | Percent |
|---|---|---|---|
| All Words | 167 | 82 | 49% |
| Top 300 Words | 71 (42%) | 26 (31%) | 36% |
| 300 - 1000 Words | 37 (22%) | 21 (25%) | 56% |
| Over 1000 Words | 59 (35%) | 35 (42%) | 59% |
Other Comments (walesscottie)
Link Words: 14 (including link phrase: 0)
Sentences: Number: 9; Average Length: 110 characters; Words/Sentence: 18
Repeated Words: and(9), food(8), consumption(4), processed(4), accounted(4), for(4), showed(3)
Chart Report Questions for Topic : food
Samples