Chart Report Sample Answer
Chart Report Title: The Changes In Per Capita Meat Consumption By Countries
Keywords or Topics: food
The samples about "The changes in per capita meat consumption by countries" are handy resources for students to enrich their writing skills of chart report.
Besides, more chart report questions sharing the topic of "food" are added to help students understand the different requirements and target the assignments precisely.
| Actions & New chart report examples |
| Chart questions and samples |
Question:
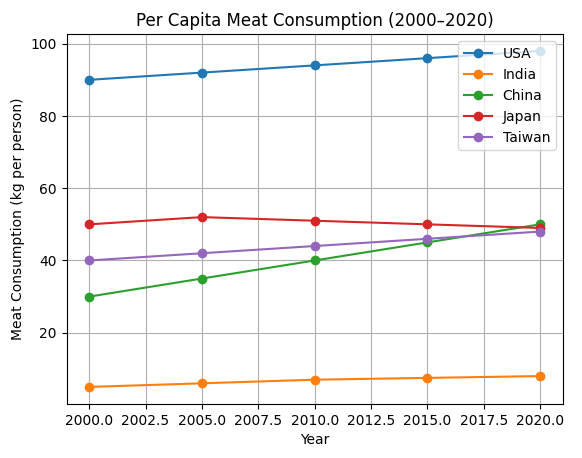
The line chart below shows the changes in per capita meat consumption (in kilograms per person per year) in the USA, India, China, Japan, and Taiwan between 2000 and 2020.
Summarize the information by selecting and reporting the main features and make comparisons where relevant.
Write at least 150 words.
Summarize the information by selecting and reporting the main features and make comparisons where relevant.
Write at least 150 words.
Answer 1
The line chart illustrates how per capita meat consumption changed in the USA, India, China, Japan, and Taiwan over a twenty-year period from 2000 to 2020...
Overall, meat consumption increased in most countries, particularly in China and India, whereas Japan experienced a slight decline...
In 2000, Americans consumed about 90 kg of meat per person annually, and this figure rose gradually to approximately 98 kg in 2020...
India consistently had the lowest meat consumption, although it did show growth, increasing from about 5 kg per person to approximately 8 kg...
In summary, while meat consumption rose in most countries, the rate of increase varied widely, with developing nations like China and India showing more marked growth than Japan...
Band: 8
Word Statistics
| Group | Word Number | Distinct | Percent |
|---|---|---|---|
| All Words | 198 | 98 | 49% |
| Top 300 Words | 66 (33%) | 25 (25%) | 37% |
| 300 - 1000 Words | 38 (19%) | 23 (23%) | 60% |
| Over 1000 Words | 94 (47%) | 50 (51%) | 53% |
Other Comments (kewalotrump)
Link Words: 12 (including link phrase: 0)
Sentences: Number: 9; Average Length: 132 characters; Words/Sentence: 22
Repeated Words: consumption(7), meat(6), and(5), india(4), china(4), from(4), 2000(4)
Chart Report Questions for Topic : food
Samples